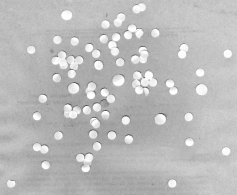
This activity involves determination of shape sizes in a binary image. This interesting activity can actually be extended to the detection of cancer cells in an image. Awesome right? *I so love AP 186!* Well, here’s how it was done.
The first step was to download the Circles002.jpg file which is an image containing scattered punched papers of the same size using a flatbed scanner. These cells were treated as cells imaged using a microscope. The goal of this step is to determine the best estimate of the cell size in pixel count given all the image processing techniques discussed in the previous activities.
It was also tasked that the determination of the cell size must be done by looping through subimages. Circles002.jpg was subdivided into 12 256×256 subimages using GIMP. Such subimages are shown below.
Note: In order to clearly see the images in this post, click on the image themselves.
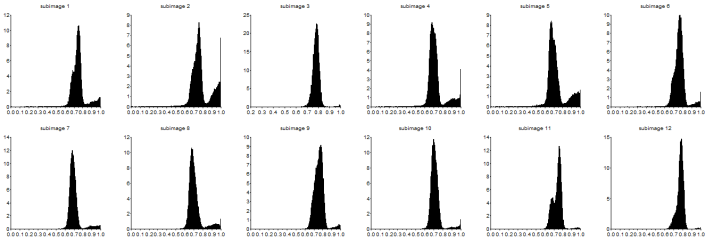
I made use of Scilab’s strcat function in order to loop though the images as I save them in one plot. This function has also enabled me to apply image processing techniques in the next sections in a faster way by means of indexing the filenames of the subimages and looping. Then I grayscaled each subimages and took their histograms. These are shown below.
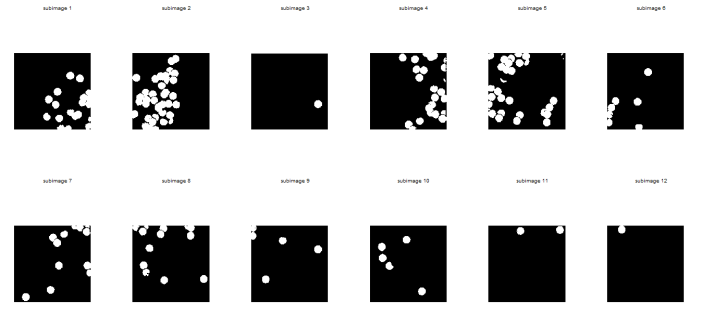
I took the threshold grayscale of each of the histograms that will make significant difference between the cells and the background. Using im2bw function of Scilab, I made use of the thresholds and converted the grayscale subimages to binary images. The binarized images are shown below. Notice that some of the images below contain white specks. I did not mind having these specks since I was aiming to establish a separation between the background and cells. The white specks will eventually be removed upon applying morphological operations.
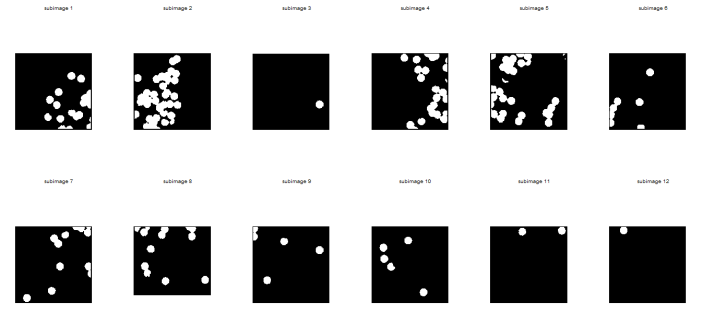
Most of the “cells” from the images above are actually overlapping. In order to distinguish one cell from another, the boundaries between them should be established. The concept of morphological operations can therefore be made use in this activity. The close and open operators can be used. Unfortunately, open is not available in SIP toolbox. But I have found out that its results can be produced upon applying dilate and then erode function of Scilab with a circular structuring element (SE). I chose to make use of such SE so that the circular shape of the cell can still be conserved. Moreover, the close operator is equivalent to erode and then dilate functions. The figure below shows the resulting images upon applying the equivalent operators for open operator. Notice that the subimages are cleaner now and the separations are more evident.
The next figure below shows the resulting images upon applying the equivalent operators for close operator. The boundaries between cells were not present in these subimages anymore so I chose the open operator for analyzing the blobs.
Note that edge detection can be used in distinguishing the shape of the cell. However, we are looking for the area of these cells in terms of pixel count. Edge detection is not applicable in this case.
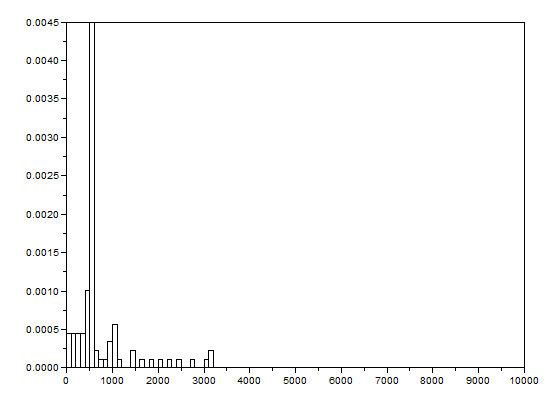
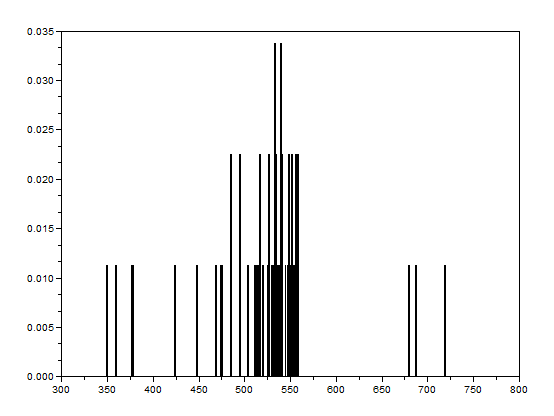
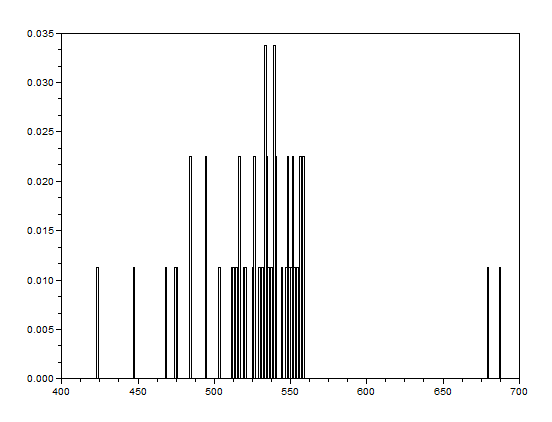
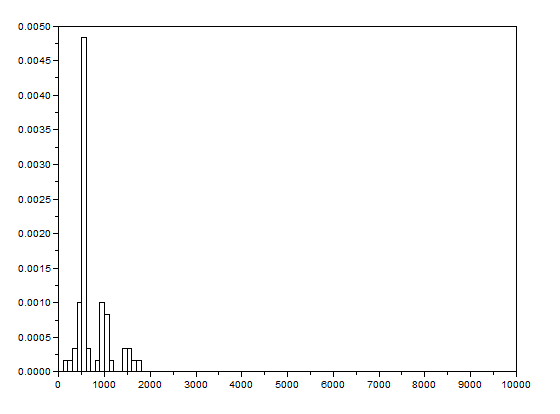
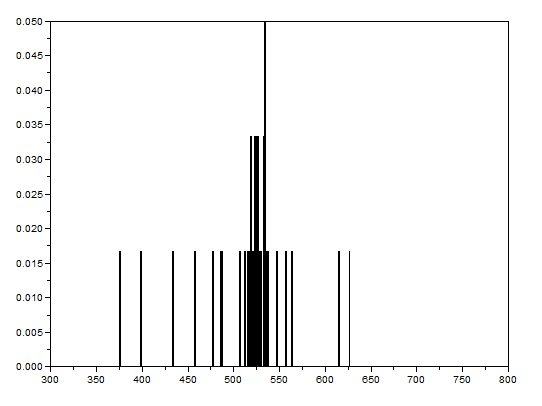
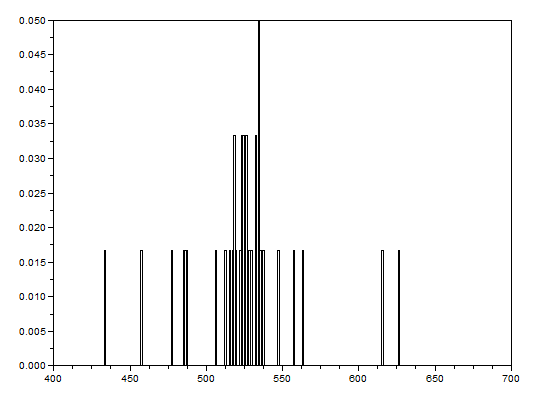
After that, the bwlabel function of Scilab was used to label the regions containing blobs. Blobs are the regions of interest (ROI) which are the isolated cells or those cells which are not overlapping. The area of a cell will be determined by counting the number of white pixels in that region containing such blobs. In other terms, the cell size is found out by means of counting the white pixels. It is applicable since the “cells” in the subimages have the same sizes. In order to know the number of white pixels, the histograms of these blobs were taken. The figure below shows the histograms of each of the blobs. The uppermost histogram has 10000 bins while the middle histogram shows the zoomed part with the x-axis ranging from 300 to 800. The lowermost histogram is also a zoomed portion with x values ranging from 400 to 700.
The best estimate of the area is 531 +- 42 pixels squared. This was calculated by summing the frequencies inside the interval [400,700] and using the mean and stdev functions of Scilab.
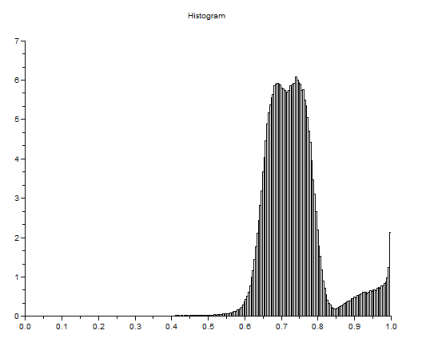
The second part of this activity involves the image entitled Circles with cancer.jpg. This is an image containing a set of punched papers of two sizes. This part aims to let us design and implement a process that could isolate the larger cells (treated as cancer cells). I decide to redo the procedures (morphological operations) above but I ought not divide the image of interest into subimages. The following figure shows the grayscale image of Circles with cancer.jpg and its histogram.
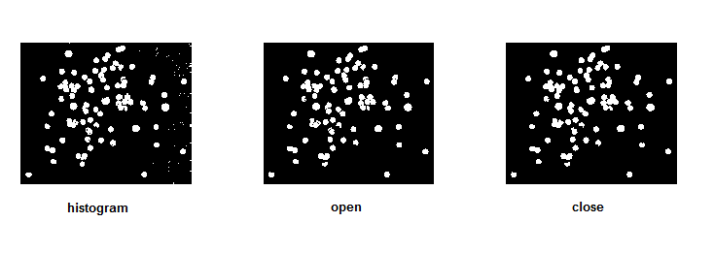
The SE in this case must be a circle again. However, this time it should be a little larger than the size of the “normal” cell, just a little bit so that it is smaller than a “cancer” cell. The figure below shows the binarized image with threshold value of 0.83 (leftmost), and the cleaned images using the equivalent SIP functions for open (middle) and close (rightmost) functions.
By histogram manipulation and bwlabel, the size and positions of the cancer cells were be determined. The histograms are shown below with different zoom levels similar in the previous histograms.
The best estimate of the cancer cell size by using the histogram is 884 +-56 pixels squared. The isolated cancers cells are shown below.
Hurrah! The best estimate for the cancer cell size is bigger than that of a normal cell. I think I got an acceptable answer. Morphological operations are really amazing! More importantly, the two raw images: Circles002.jpg (upper) and Circles with cancer.jpg (lower) are shown below.
Since the best estimate for the size of a normal cell was determined, we can tell whether a cell is abnormal or cancerous now. The purpose of using subimages in this case is to exercise us on how to process several samples. I noticed that the processing for isolating the cancer cells took longer than the usual processing of images. But the result is worth waiting. In this activity, I will give myself a grade of 10 since I did every part with much enjoyment. :3
Reference:
1. Maricor Soriano, “A10-Applications of Morphological Operations 3 of 3: Looping through Images”, 2008.

