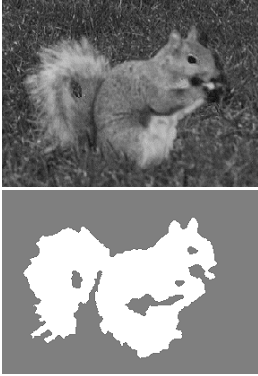
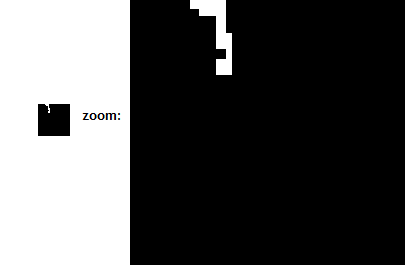
Image segmentation is an image processing technique where a region of interest (ROI) of an image is selected for further processing. It can be applied in grayscale images by means of getting the thresholding value [1] .The next figure shows an example
Figure 1. Grayscale image segmentation [2]
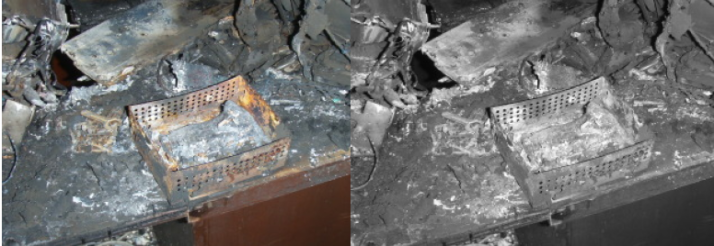
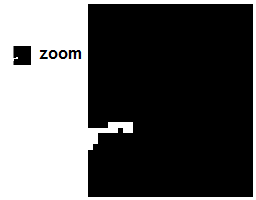
However, the desirable image sometimes cannot be obtained by thresholding. Say for example the ROI of an image has the same grayscale pixel value with the surrounding area. One cannot simply use thresholding for segmentation in this case. See the next figure for an example.
Figure 2. If the rust-colored box is the ROI, it will be very complicated to segment in grayscale [1]
For a truecolor image, segmentation can be done by getting the probability that a pixel is under a specific color distribution of interest (color distribution of the ROI) and the histogram. This is actually the task for this activity.
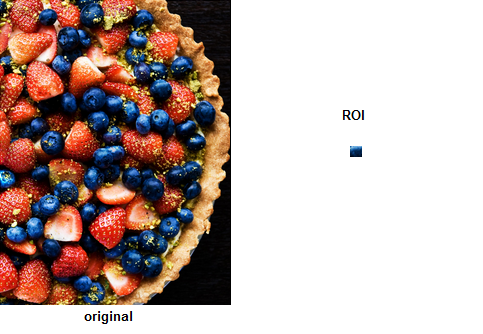
The first step for this process is to get a truecolor image and crop the ROI from the image. The following figure shows the image I have selected and the ROI.
Figure 3. All berries tart [3] and the ROI.
The RGB channels of the truecolor image sample is then transformed to normalized chromaticity coordinates (NCC). NCC are coordinates in a color space which can separate brightness and chromaticity. These are expressed as
Note that r+g+b = 1. We can then use only two coordinates and the remaining can be taken by the known values. For this case, r and g are used and b= 1-r-g. In the color space we will use, I tells the brightness and, r and g tells the chromaticity. We then call it r-g color space or NCC space. It is illustrated below
Figure 4. Normalized chromaticity chromaticity (NCC) space.
The said probability above involves the probability distribution function (PDF). It is actually the histogram normalized by the number of pixels of the ROI. For this case, the space has r and g. The joint PDF is therefore p(r)p(g) which tests the likelihood of a pixel to belong to the ROI. A Gaussian distribution can be used. Thus, the probability that a certain pixel with r chromaticity is a member of the ROI is expressed as
where μ_r and μ_g are the mean and σ_r and σ_g are the standard deviation from the R and G image channels. A similar way goes for the probability for a pixel with g chromaticity. The joint PDF is the product of the two PDFs.
There are two ways to do color image segmentation: Parametric segmentation and Non-parametric segmentation.
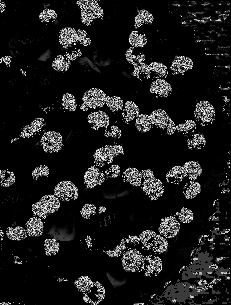
For parametric segmentation, the Gaussian PDF was used to segment the image. My segmented image is shown below.
Figure 5. Segmented Image using Parametric Segmentation.
Note: To clearly see the images, just click the image themselves. 😀
For the non-parametric segmentation, the 2D histogram of the ROI was used to determine whether the pixels belong to the ROI. It is shown below.
Figure 6. 2D histogram of the ROI from Figure 3.
To check whether my 2D histogram of the ROI is correct, I compared it with the NCC space from Figure 4. Since in images, the origin is in the upper right corner, the histogram should be rotated by 90 degrees. By doing so, we get the following figure.
And yes, comparing the above image with Figure 4, I think my histogram is correct. The colors are along the bluish, cyanish region since the ROI is a part of a blueberry.
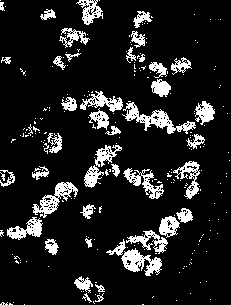
To get the segmented image, backprojection is done. From the color histogram of Figure 6, the pixel location is assigned with a value equal to the histogram in NCC space. My generated segmented image is shown below.
Figure 7. Segmented Image using Parametric Segmentation.
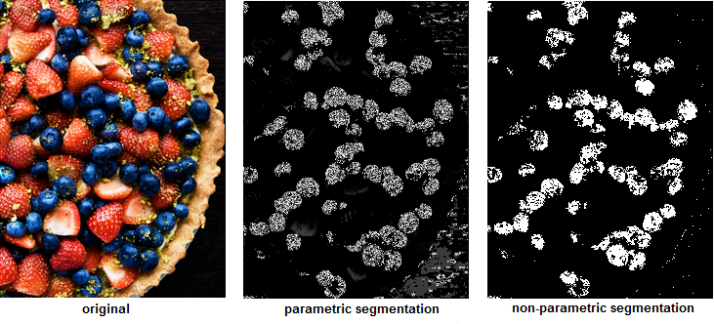
For better comparison, the original and segmented images are shown below.
Figure 8. Original and segmented images
From Figure 8, we can see that in general, non-parametric segmentation produced a more concrete segmented image. The segmented image using parametric segmentation actually uncovered more blueberries. It looks powdery but the shapes of the blueberries are more rendered. However, some of the black regions of the background were included in the segmentation. For non-parametric segmentation, some (very small areas) blueberries were hidden but the segmented image gave a higher similarity with the original images. The black background was not mistaken as part of the ROI (blueberry skin). The parametric segmentation gave clusters of points while the non-parametric segmentation gave shapes.
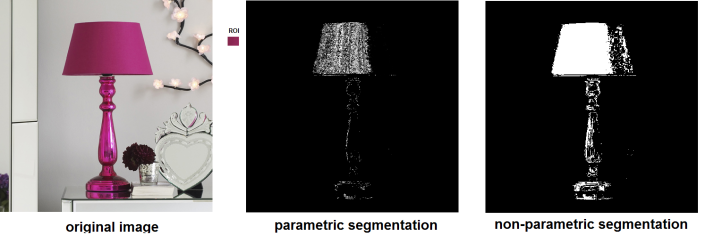
Here are some of image samples I used and processed. My observations were similar with those from Figure 8.
The original image above was obtained from reference [4]. Non-parametric segmentation won for this image type. 😉 I think it must be much better than parametric segmentation since histogram backprojection was used. Parametric segmentation assumed a Gaussian PDF which is not always the case so I think it won’t produce desirable results all the time.
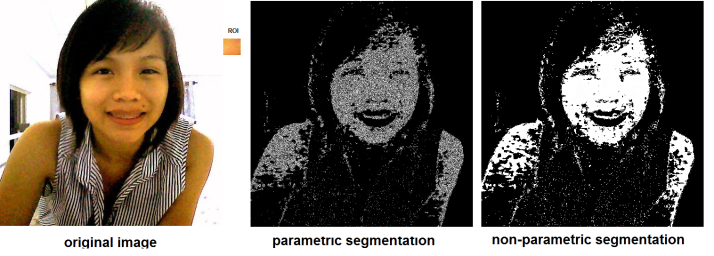
Ma’am Jing encouraged us to employ the newly taught image processing technique as face detector. The results are shown below. Non-parametric segmentation really gave a more detailed result.
I found segmentation techniques amazing because knowing that the ROI has dark pixels for the berries tart, the generated segmented images were actually pleasing. The black background was not entirely tagged as part of the ROI.
For this activity, I give myself a grade of 10 for doing all of the steps on time (Yay!).
References:
1. Maricor Soriano, “A11 – Color Image Segmentation”, 2010.
2. “Image Segmentation”, retrieved from http://www.cs.cmu.edu/~jxiao/research.html.
3. “Berries & Tarts”, retrieved from http://4cakesinacup.com/page/4/.
4. “NtB Loves: Thinking Pink, Again”, retrieved from http://manolohome.com/2009/11/10/ntb-loves-thinking-pink-again/.
