To capture a certain moment in our lives, we usually take images. Hence, these images should be of good quality to be more appreciated.
This activity deals with image analysis. That is why large arrays are investigated. Thus, the number of stacksize in Scilab was primarily set to a large value in order to store many variables. For my case, I used
Figure 1. Setting the stacksize.
The first type of image I investigated for this activity is the binary image. Binary images are images that contain only black or white pixels, i.e., their pixel values are only 0 or 1 or what we call bits.
I thought of using a printscreen image of the command prompt at first since I thought the colors in that image were only black and white. It turns out that when I pasted an image of the command prompt in MS Paint Version 6.1 for Windows 7 Starter, there were gray pixels present! As I zoomed in, the edges of the letters have gray pixels. I expected that the white edges of the letters will be immediately surrounded by the black background. But no. 😦
I have learned that the image properties can be set to Black and white in MS Paint by clicking the Paint menu then Properties. Thanks to Gino Borja for that idea. By doing so, the image of the command prompt became indistinct since only black and white pixels were recognized. That’s why I drew another image using MS Paint and set the color properties to Black and white. Out of my curiousity, I saved this image as bitmap, jpg and png to investigate which format will produce a bit depth of 1 and that the pixels values will be faithfully 0 or 1. It turns out that the bit depth is 1 when the format is monochrome bitmap, 16 when 16 color bitmap, 8 when 256 color bitmap, 24 when 24-bit bitmap (as expected), 24 when jpg and 1 when png. I’ve known such values upon looking at the Details tab of Properties when I right-clicked the images.
I also noticed that I can actually draw anything I want in MS Paint and save it as monochrome bitmap so that the bit depth is 1, i.e., it is black and white. I finally decided to use the png format to be consistent with other image types. As I zoomed in using MS Paint, the only colors present are black and white. No intermediate colors were present. The image is 3.14 kB and its dimensions is 508 x 512 pixels. It is shown in Figure 2.
Figure 2. Binary image created using MS Paint
When I used imread, it displays a big array describing the said image and only contains 0 and 255. However, I was expecting o’s and 1’s because it is a binary image.
I made another simple way to determine if the image is binary. The Scilab code is shown below. I just modified the starting commands from the Scilab code from the laboratory manual. In the console, the last semicolon is omitted to see the answer. The answer should be an empty set for it to be binary as this code looks for the indices of values greater than 1.
Figure 3. Scilab code to check if the image is binary
Then I examined my binary image using the following code
Figure 4. Size function of Scilab
The output of the size is
512. 508. 3.
This output tells us that the binary image has the dimensions of 508 x 512 pixels and it has 3 two-dimensional matrices with 508×512 pixels each. These are the RGB values. This means that the binary image I used was read as a Truecolor image. To display more of the properties of the image, I used imfinfo. The Scilab code is shown below
Figure 5. Scilab and imfinfo command
The outputs of imfinfo for my binary image are the following:
File size – 3224. (bytes)
Width – 508. (pixels)
Height – 512. (pixels)
Bit depth – 8. (number of bits per pixel)
Color Type – truecolor
Therefore, the binary image is really accepted by Scilab as a truecolor image. However, when I look at the properties/details of the binary image itself by right-clicking, the bit depth is 1.
The second type of image is grayscale image. Figure 6 shows my grayscale image of a teddy bear. Grayscale or greyscale images are also black and white images. However, the pixel values range from 0 (black) to 255 (white). Therefore, the are different shades of black and white in this image. For this case, a pixel is equal to a byte.
Figure 6. Grayscale image of a teddy bear.
I used size and imfinfo commands and the outputs are
size: 1944. 2592. 3.
imfinfo:
File size – 976867. (bytes)
Width – 2592. (pixels)
Height – 1944. (pixels)
Bit depth – 8. (number of bits per pixel)
Color Type – truecolor
As I checked the properties by right-clicking the image, the dimensions and file size are correct but the bit depth is 24.
The third type of image is a truecolor image. It has three channels or bands showing different intensities of red, green and blue pixels. An example is shown in Figure 7.
Figure 7. A truecolor image.
By using the Scilab codes in Figures 4 and 5, the results are:
size: 1552. 2455. 3.
imfinfo:
File size -1339340. (bytes)
Width – 2455. (pixels)
Height -1552. (pixels)
Bit depth – 8. (pixels)
Color Type – truecolor
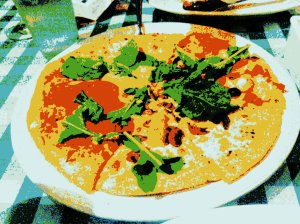
Still, the dimensions and size are consistent but the bit depth is 24 when I right-clicked the image. The fourth type of image is an indexed image. It is a colored image are represented by numbers representing the index numbers of the colors of a color map. It usually has smaller information than truecolor images. For my indexed image, I used a photograph of a pizza.
Figure 8. Indexed image of a pizza.
The specifications are as follows:
size: 1944. 2592. 3.
imfinfo:
File size – 996481. (bytes)
Width – 2592. (pixels)
Height -1944. (pixels)
Bit depth – 8. (pixels)
Color Type – truecolor
Again, the size and dimensions are the same but the bit depth is 24.
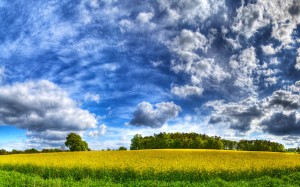
The fifth type of image is called High Dynamic Range (HDR) image. It is usually used to show finer details of objects or phenomena. Examples of this type are x-rays, cloud images, explosions and plasma. These images can be stored in 10 to 16-bit grayscale images. An example is shown in Figure 8.
Figure 9. HDR image of nature [1].
Using imread, size and imfinfo to Figure 9, the outputs are
size: 800. 1280. 3.
imfinfo:
File size -468200. (bytes)
Width – 1280. (pixels)
Height – 800. (pixels)
Bit depth – 8. (pixels)
Color Type – truecolor
However, the bit depth is 24 upon right-clicking. The size and dimensions are the same.
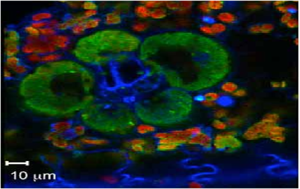
The sixth type of image is called Multispectral or Hyperspectral Image. These usually have bands or channel of RGB values in the order of 10. An example is shown below.
Figure 10. A Hyperspectral fluorescene image of corn leaf [2].
The details are shown below. Note that the bit depth upon right-clicking is 32.
size: 297. 471. 3.
imfinfo:
File size – 338868. (bytes)
Width – 471. (pixels)
Height -297. (pixels)
Bit depth – 8. (pixels)
Color Type – truecolor
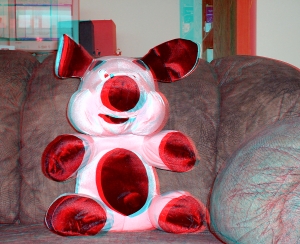
The seventh type of image is 3D image. This type shows the spatial information such as depth and angles and may contain two or more images. An example is shown below.
Figure 11. A 3D image of a stuff toy [3].
The specifications are shown below using size and imfinfo function of Scilab.
size: 1200. 1470. 3.
imfinfo:
File size – 2887771. (bytes)
Width – 1470. (pixels)
Height – 1200. (pixels)
Bit depth – 8. (pixels)
Color Type – truecolor
The bit depth upon right-clicking is 24. Moreover, the dimensions are consistent with the results shown above
The last image type is Temporal image or Video. This is a series of frames which has now high definition and high frame rates. An example is depicted below. The video from Youtube [4] is about different fast events or processes that are shown in slow manner.
http://www.youtube.com/watch?v=71nURVXXeaM&feature=related
The first four types of images are basic and the rest are known as advanced image types.
As I used help in the Scilab console to check for imfinfo, the only colortype available are ‘grayscale’ and ‘truecolor’. Based on what I did for this activity, I have learned that Scilab considers the image to be truecolor unless otherwise it is converted to grayscale.
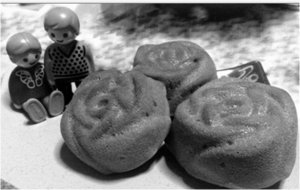
The next part of this activity is to convert the truecolor image in Figure 7 to binary and grayscale. The Scilab code is shown below.
Figure 12. Scilab code for conversion from truecolor image to binary and grayscale images.
Unfortunately, there was an error than hinders the program to show the binary and grayscale images as I executed the code. The error is:
–>imshow(I)
!–error 17
stack size exceeded!
Use stacksize function to increase it.
Memory used for variables: 7907952
Intermediate memory needed: 2154566
Total memory available: 10000000
at line 13 of function typeof called by :
at line 22 of function char called by :
at line 28 of function imshow called by :
imshow(I)
Even when I increased the stacksize up to the maximum, 268435454, the same error appeared. I restarted my laptop and cleared the variables but the same error has appeared. I believe the image was just too large. I have encountered this type of error in the previous images for this activity. I just increased the stacksize and it worked. But for this case, I find it time consuming so I just resized my truecolor image. The new size has the following details:
File size – 314732. (bytes)
Width – 398. (pixels)
Height – 252. (pixels)
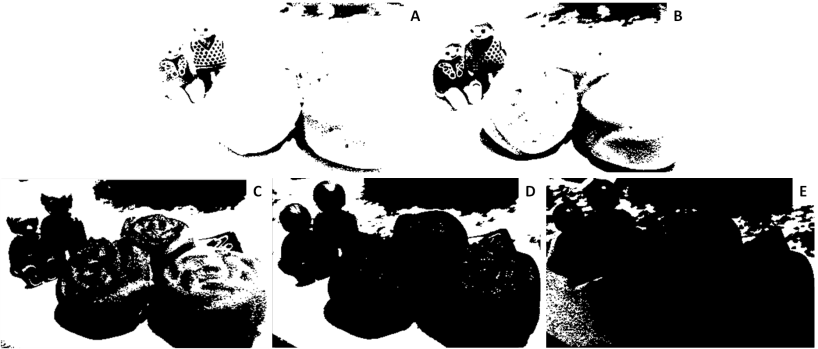
The truecolor image was converted to binary images with different threshold values. The size of all the binary images despite having different appearance is 398×252 pixels. This is the same with the truecolor image of interest. It is expected since the conversion only changed the value of each pixels but not the dimensions. Moreover, there is no indicated number of channels upon using size function Scilab. This means that Scilab reads it as a binary image. These are shown below.
Figure 13. Grayscale images of the truecolor image from the resized Figure 7 with (a) 0.2, (b) 0.3, (c) 0.5, (d) 0.7 and (e) 0.9 threshold values.
Figure 13 shows that as the threshold value approaches 0, the image becomes nearly white. As the threshold approaches 1, the grayscale image darkens. The threshold value ranges from 0 to 1 only. It is because if the pixel value is greater than the threshold, it will be marked as 1 (white) and 0 (black) otherwise.
Figure 14 shows the grayscale image of the truecolor image. The pixel values for this image are ranging from 0 (black) to 255 (white) upon using rgb2gray function.
Figure 14. Converted grayscale image of the truecolor image
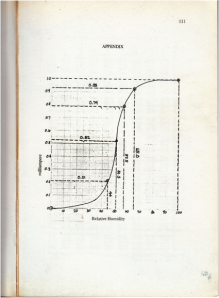
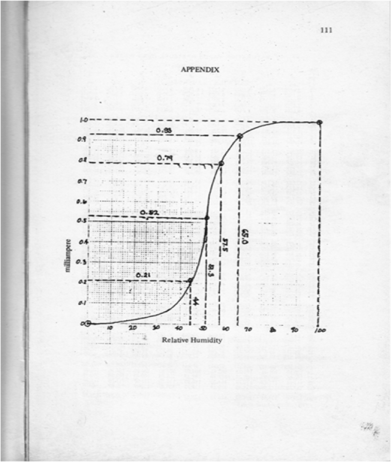
The next part of the activity is to convert the scanned plots from Activity 1 to grayscale and investigate the graylevel histogram of the image. The 425 x 577 scanned image is shown below. The original scanned image’s dimensions is 2004 x 2724 pixels. I reduced the size for this activity so the processing time is faster. The scanned plot is shown below.
Figure 15. Scanned image of the hand-drawn plot from Activity 1.
The image from Figure 15 was grayscaled using rgb2gray function. The imhist function was used to obtain its histogram. The Scilab code is shown below.
Figure 16. Scilab code for the histogram analysis
The dimensions of the grayscale and truecolor images are both 425 x 577 pixels. However, the grayscale has no indicated number of channels while the truecolor has 3 channel as indicated by the size function. The corresponding grayscale image is shown below
Figure 17. Grayscale image of Figure 15.
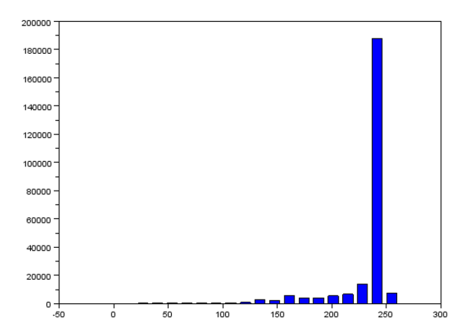
The grayscale image from Figure 17 is investigated using histogram. Its histogram is shown below
Figure 18. Graylevel histogram of Figure 17.
From Figure 18, it can be seen that there are many pixels, about 185000 pixels out of 245225 pixels, have a pixel value of 241.57895 which is nearly white. It can bee seen from Figure 17 that the dominating color is white indeed. Then Figure 15 is converted is black and white, i.e., binary image. I used imbw function to convert it. Figure 19 shows the black and white image with a threshold of 0.5.
Figure 19. Binary image of Figure 15.
The Scilab code for this conversion to binary image is shown in below.
Figure 20. Scilab code for converting a scanned truecolor image to binary or black and white image.
For the last part of the activity, different image formats are discussed:
Graphics Interchange Format (GIF) is a format that has a limited 256-color value palette from a set of about 16 million color values. Thus, if the picture has only 256 colors or fewer, this format will store the entire image without compression, i.e., it is lossless. Otherwise, its algorithm will reduce the colors and approximate the nearest color value of the pixels. For an image with lots of colors, GIF format will be lossy. This format are often used in web pages [5].
Portable Network Graphics (PNG) format is a lossless image format. It uses patterns in compressing the size of the image. It is usually used as web image and it can do everything that GIF can do. And sometimes, PNG is better so it might replace GIF in the future (according to [5]). However, it cannot replace JPG because the latter is good at compression while keeping a good quality of image at a small image size [5].
Tag Image File Format (TIFF) can be a lossless or lossy format. It is usually used as a lossless image format and is usually unsupported by internet browsers [5].
Joint Photographic Experts Group (JPEG, JPG for short) is usually used for photos that has several colors. It stores images with 24-bit color. It is good in finding the best compression ratio to maintain the quality of the image. One way is by omitting colors that has low probability that the human eye can notice. However, the compression of JPG can be adjusted using photo editors. By these information, JPG is a better format for photos than GIF [5].
Bitmap (BMP) is a protected format by Microsoft [5]. According to [5], there is no reason to use this kind of format.
Raw file (RAW), from the name itself, is an unprocessed format maintaining the quality of the image [6]. It has the original RGB pixels by the sensor of the camera as it passes through an analog-to-digital converter (ADC). Nikon calls it NEF file [7]. It is basically a lossless output image of camera. Since these are lossless, they usually take large storage space. Manufacturers have unique RAW formats so it not advantageous to use this for general purposes. The manufacturer’s software should be used to access the file [5].
Encapsulated PostScript (EPS) usually used as a screen preview. It is the only format that can use transparent white in bitmap [8].
PSD, PSP, etc., are patented formats of different graphics programs. For example, Photoshop has PSD format and Paint Shop Pro files has PSP format. These working formats are used to access the image, especially when it is complex. Editting these files by converting to other formats might lead to lossy images [5]. Windows Metafile (WMF) are files consisting of calls to Microsoft graphics [8].
From these different image formats, I have learned that even when I did my best to make an image of great quality, some information might be lost upon saving the image with the wrong format. It is very essential to look for and choose the best format for a specific case.
For this activity, I give myself a grade of 10/10 since I did everything that was tasked. Moreover, I also varied some variables which can affect the resulting images.
References
1. “HDR Sky desktop wallpapers download”, available at http://www.zastavki.com/pictures/1280×800/2009/Nature_Seasons_Summer_HDR_Sky_017902_.jpg.
2. “Biochemical Imaging”, available at http://bio.sandia.gov/solutions/imaging.html.
3. “Digital 3d Photos”, available at http://www.heuristicresearch.com/media/d3d.html.
4.”Amazing Super Slow Motion”, available at http://www.youtube.com/watch?v=71nURVXXeaM&feature=related.
5. “Digital Image File Types Explained”, available at http://www.wfu.edu/~matthews/misc/graphics/formats/formats.html.
6. “Camera RAW”, available at http://www.techterms.com/definition/cameraraw.
7.”RAW, JPEG and TIFF”, available at http://photo.net/learn/raw/.
8. “Understanding Image File Formats”, available at http://amath.colorado.edu/computing/graphics/understand_fmts.html.
9. “Acronyms & Abbreviations”, available at http://www.abbreviations.com.
10. Maricor Soriano, “A3 – Image Types and Formats”, Applied Physics 186 Laboratory Manual, 2010.


